Montana’s unemployment rate hit a new record low in December, dropping another 0.3 percentage points to end the year at 2.5%, according to the U.S. Bureau of Labor Statistics (BLS). The number of unemployed Montanans is at its lowest level since BLS began the data series in 1976.
Wallet Hub reports that Montana ranks four in the nation as states whose unemployment rates have bounced back the most. And, Montana ranks fifth among states with the lowest unemployment, based on Bureau of Labor data. It is among sixteen of the top 20 states reporting the most jobs recovered since COVID-related lockdowns began in March 2020 – all of which are led by Republican governors.
The State of Montana has not only recovered all jobs lost since the start of the pandemic, but also grown beyond that level, with 531,040 Montanans employed in December 2021 compared to 521,657 in March 2020.
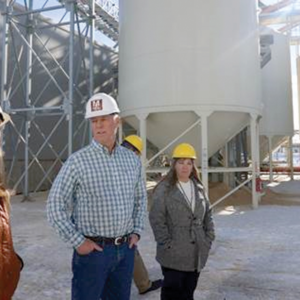
Montana Governor Greg Gianforte credits his Montana Comback Plan. He said, “After just one year, our Montana Comeback Plan is working. Our unemployment rate is the lowest it’s ever been, and more Montanans are working than ever before in our state’s history. With lower taxes and responsible, responsive government, our economy is going again, we’re open for business, and Montanans are back to work. Great work, Montana!”
The number of unemployed Montanans also dropped to a record low of 13,689, falling by 1,719 from November.
Montana’s total employment hit a record high in December at 531,040. Total employment, which includes payroll, agricultural, and self-employed workers, grew by 3,137 in December, the largest single month gain in 2021. Payroll employment also increased by 3,200 with strong job growth in retail.
Since Governor Gianforte was sworn in, total employment has grown by 20,568 jobs.
Montana’s labor force increased to 544,729 in December, the third highest level in the state’s history. The number of available workers in Montana’s labor force, a critical metric during the current labor shortage, increased by 1,418.
The unemployment rate for the U.S. dropped to 3.9%. Overall, 24 Republican-led states reported recovering at least two-thirds of their lost jobs by December 2021, according to BLS data.
The nine states reporting the greatest percentage gains in recovered jobs are all led by Republican governors, according to the Department of Labor’s Bureau of Labor Statistics. In terms of percentage increases, Utah’s 142 percent was the highest, adding 200,000 jobs as of December 2021, surpassing the 140,000 coronavirus-related jobs it lost. The rest are Idaho, Texas, Arizona, Montana, Georgia, Arkansas, Tennessee, and Florida. North Carolina, led by a Democratic governor, rounds out the top 10.
By sheer numbers, Texas reported the most jobs recovered – 1,542,000 by December 2021 – compared to the 1,452,600 jobs lost after March 2020.
Texas Greg Abbott credits Texas’ job growth to pro-growth economic policies, a predictable regulatory environment, and a young, growing, and diverse workforce.
Of the state’s job growth continuing to outperform the nation’s, Florida Gov. Ron DeSantis said, “Month after month, the data continues to show that freedom first economic policies create jobs and keep our economy moving. Our new businesses and workforce growth show that Floridians have the opportunities they need to thrive. We will continue to lead the nation in economic growth because we value the individual freedoms of Floridians and protect the ability for our citizens to succeed.”
According to BLS data, 12 states set new unemployment rate lows (series began in 1976). They include Arkansas (3.1 percent), Georgia (2.6 percent), Idaho (2.4 percent), Indiana (2.7 percent), Kentucky (3.9 percent), Mississippi (4.5 percent), Montana (2.5 percent), Nebraska (1.7 percent), Oklahoma (2.3 percent), Utah (1.9 percent), West Virginia (3.7 percent), and Wisconsin (2.8 percent).
California and Nevada, both led by Democratic governors, had the highest unemployment rates of 6.5 percent and 6.4 percent, respectively.
Overall, Democrat-led states reported an average unemployment rate of 4.9 percent, higher than the national average of 3.9 percent and the 3.4 percent average of 27 Republican-led states was.
The outliers are Alaska and Texas, with the highest unemployment rates of Republican-led states of 5.7 percent and 5 percent, respectively.
According to Wallet Hub Nebraska, Utah, and Oklahoma are the rank above Montana as state’s whose unemployment has bounced back the most, and it ranks New York, California, New Jersey, Nevada and Hawaii as states that have bounced back the least.